cross-border-payments
THE 2026 GLOBAL BANKING FRICTION REPORT
- Why Cross-Border Payments Still Break—and How Hybrid Rails Actually Fix It
- 1. The Institutional Crisis: De-Risking and the Contraction of Correspondent Banking
- 2. Technical Latency: SWIFT gpi vs. Cryptographic Settlement Rails
- 3. The ISO 20022 Paradox: Why the Fix Is Breaking Things
- 4. The Compliance Tax: The Cost of Screening $1 Quadrillion
- 5. The “Middleman” Spread: Hidden FX Costs in Legacy Corridors
- 6. The Risks: Illicit Finance and the Stablecoin Problem
- 7. The 2027 Horizon: Programmable Money and Unified Ledgers
- Methodology
- References
Why Cross-Border Payments Still Break—and How Hybrid Rails Actually Fix It
Research Report • Q1 2026
Sources: BIS, ECB, IMF, World Bank, Chainalysis, TRM Labs, Deloitte, CPMI
Executive Summary
In 2024, cross-border payments reached an estimated $1 quadrillion in total volume—wholesale and retail combined. [1] The infrastructure carrying that volume is under visible strain. Over the past seven years, correspondent banking relationships contracted by 20%. [2] In 2025 alone, over 120 significant correspondent links were severed in emerging markets. [3] The Real-Time Gross Settlement systems that underpin actual fund movement operate for just 66 hours per week out of a possible 168. [4]
Banks spend $206 billion a year on AML compliance, yet 99% of the alerts their systems generate are false positives. [5] The ISO 20022 migration—intended to fix data quality—has introduced a “coexistence phase” where legacy format translations create a 60% manual intervention rate on cross-border flows. [6] [7] Stablecoins now account for 84% of all illicit crypto transaction volume. [8]
On the other side: Ethereum Layer 2 networks settle stablecoin transactions in 3–5 seconds, around the clock, for less than $0.50 per transaction. [9] This report examines the structural fault lines in global payments as of early 2026—and the trade-offs that come with alternative architectures.
1. The Institutional Crisis: De-Risking and the Contraction of Correspondent Banking
Correspondent banking—the bilateral network of Nostro and Vostro accounts that enables international fund transfers—is shrinking. According to the Committee on Payments and Market Infrastructures (CPMI) at the Bank for International Settlements, active relationships in the global correspondent banking network fell by approximately 20% over a seven-year span leading into the mid-2020s. Active payment corridors dropped by roughly 10%. [2]
Between 2024 and 2026, the contraction accelerated. Industry analysis estimates that over 120 significant correspondent banking relationships were severed or heavily restricted in emerging markets in 2025 alone. [3]
The cause is a straightforward cost-risk calculation. When a Tier-1 bank determines that the marginal revenue from processing low-value, high-frequency transactions for a respondent bank in a developing nation is eclipsed by compliance overhead and the tail risk of a multi-billion dollar regulatory fine, the rational decision is to exit. The result is an increasingly concentrated pool of remaining correspondent providers, which raises systemic fragility and creates single points of failure across entire regions.
The Pacific Basin: When Countries Lose Access
In 2025, eight Pacific Island nations—Fiji, Kiribati, the Marshall Islands, Samoa, Solomon Islands, Tonga, Tuvalu, and Vanuatu—faced the potential collapse of their connectivity to global trade and remittance corridors. These countries were compelled to commit $9 million each from their International Development Association (IDA) allocations to subsidize and safeguard their remaining financial links. [10] [11]
The intervention, coordinated by the Pacific Islands Forum Secretariat (PIFS) and the World Bank, illustrates a specific pattern: when commercial banks exit sovereign nations due to compliance costs, governments and multilateral institutions absorb the burden. Rodney Kirarock of the PIFS described the loss of correspondent banking links as one of the most urgent financial challenges facing the Pacific region. [10]
Collateral Damage: SMEs and Trade Finance
When local respondent banks lose access to international correspondent services, their corporate clients—particularly small and medium-sized enterprises—experience immediate declines in export volumes. These firms depend on trade finance and letters of credit. They rarely offset the sudden loss of international market access through domestic sales. [12] [13]
The downstream effect is revenue contraction, job losses, and in severe cases, insolvency. There is also a structural irony: by pushing legitimate actors out of the regulated system, de-risking forces transactions through unregulated shadow networks and cash couriers—increasing the very money laundering risks the regulatory apparatus was designed to prevent.
2. Technical Latency: SWIFT gpi vs. Cryptographic Settlement Rails
SWIFT’s Global Payments Innovation (gpi) protocol has delivered measurable improvements. End-to-end tracking via Unique End-to-End Transaction References (UETR), fee transparency, and faster message routing are real upgrades. [14] Performance data from 2025–2026 shows that nearly 50% of gpi payments are credited to beneficiaries within 30 minutes, 40% within 5 minutes, and almost 100% within 24 hours. In high-liquidity corridors, 75% of payments reach beneficiary banks within 10 minutes—exceeding G20 targets. [15] [4]
The structural limitation is that SWIFT moves instructions, not money. Actual fund settlement depends entirely on national Real-Time Gross Settlement (RTGS) systems, which operate for an average of just 66 hours per week. [4] A transaction initiated outside overlapping domestic windows—say, a Tokyo-to-New-York transfer on a Friday evening—queues until the settlement system reopens. The speed of the SWIFT message becomes irrelevant when the bottleneck is the settlement layer, not the messaging layer.
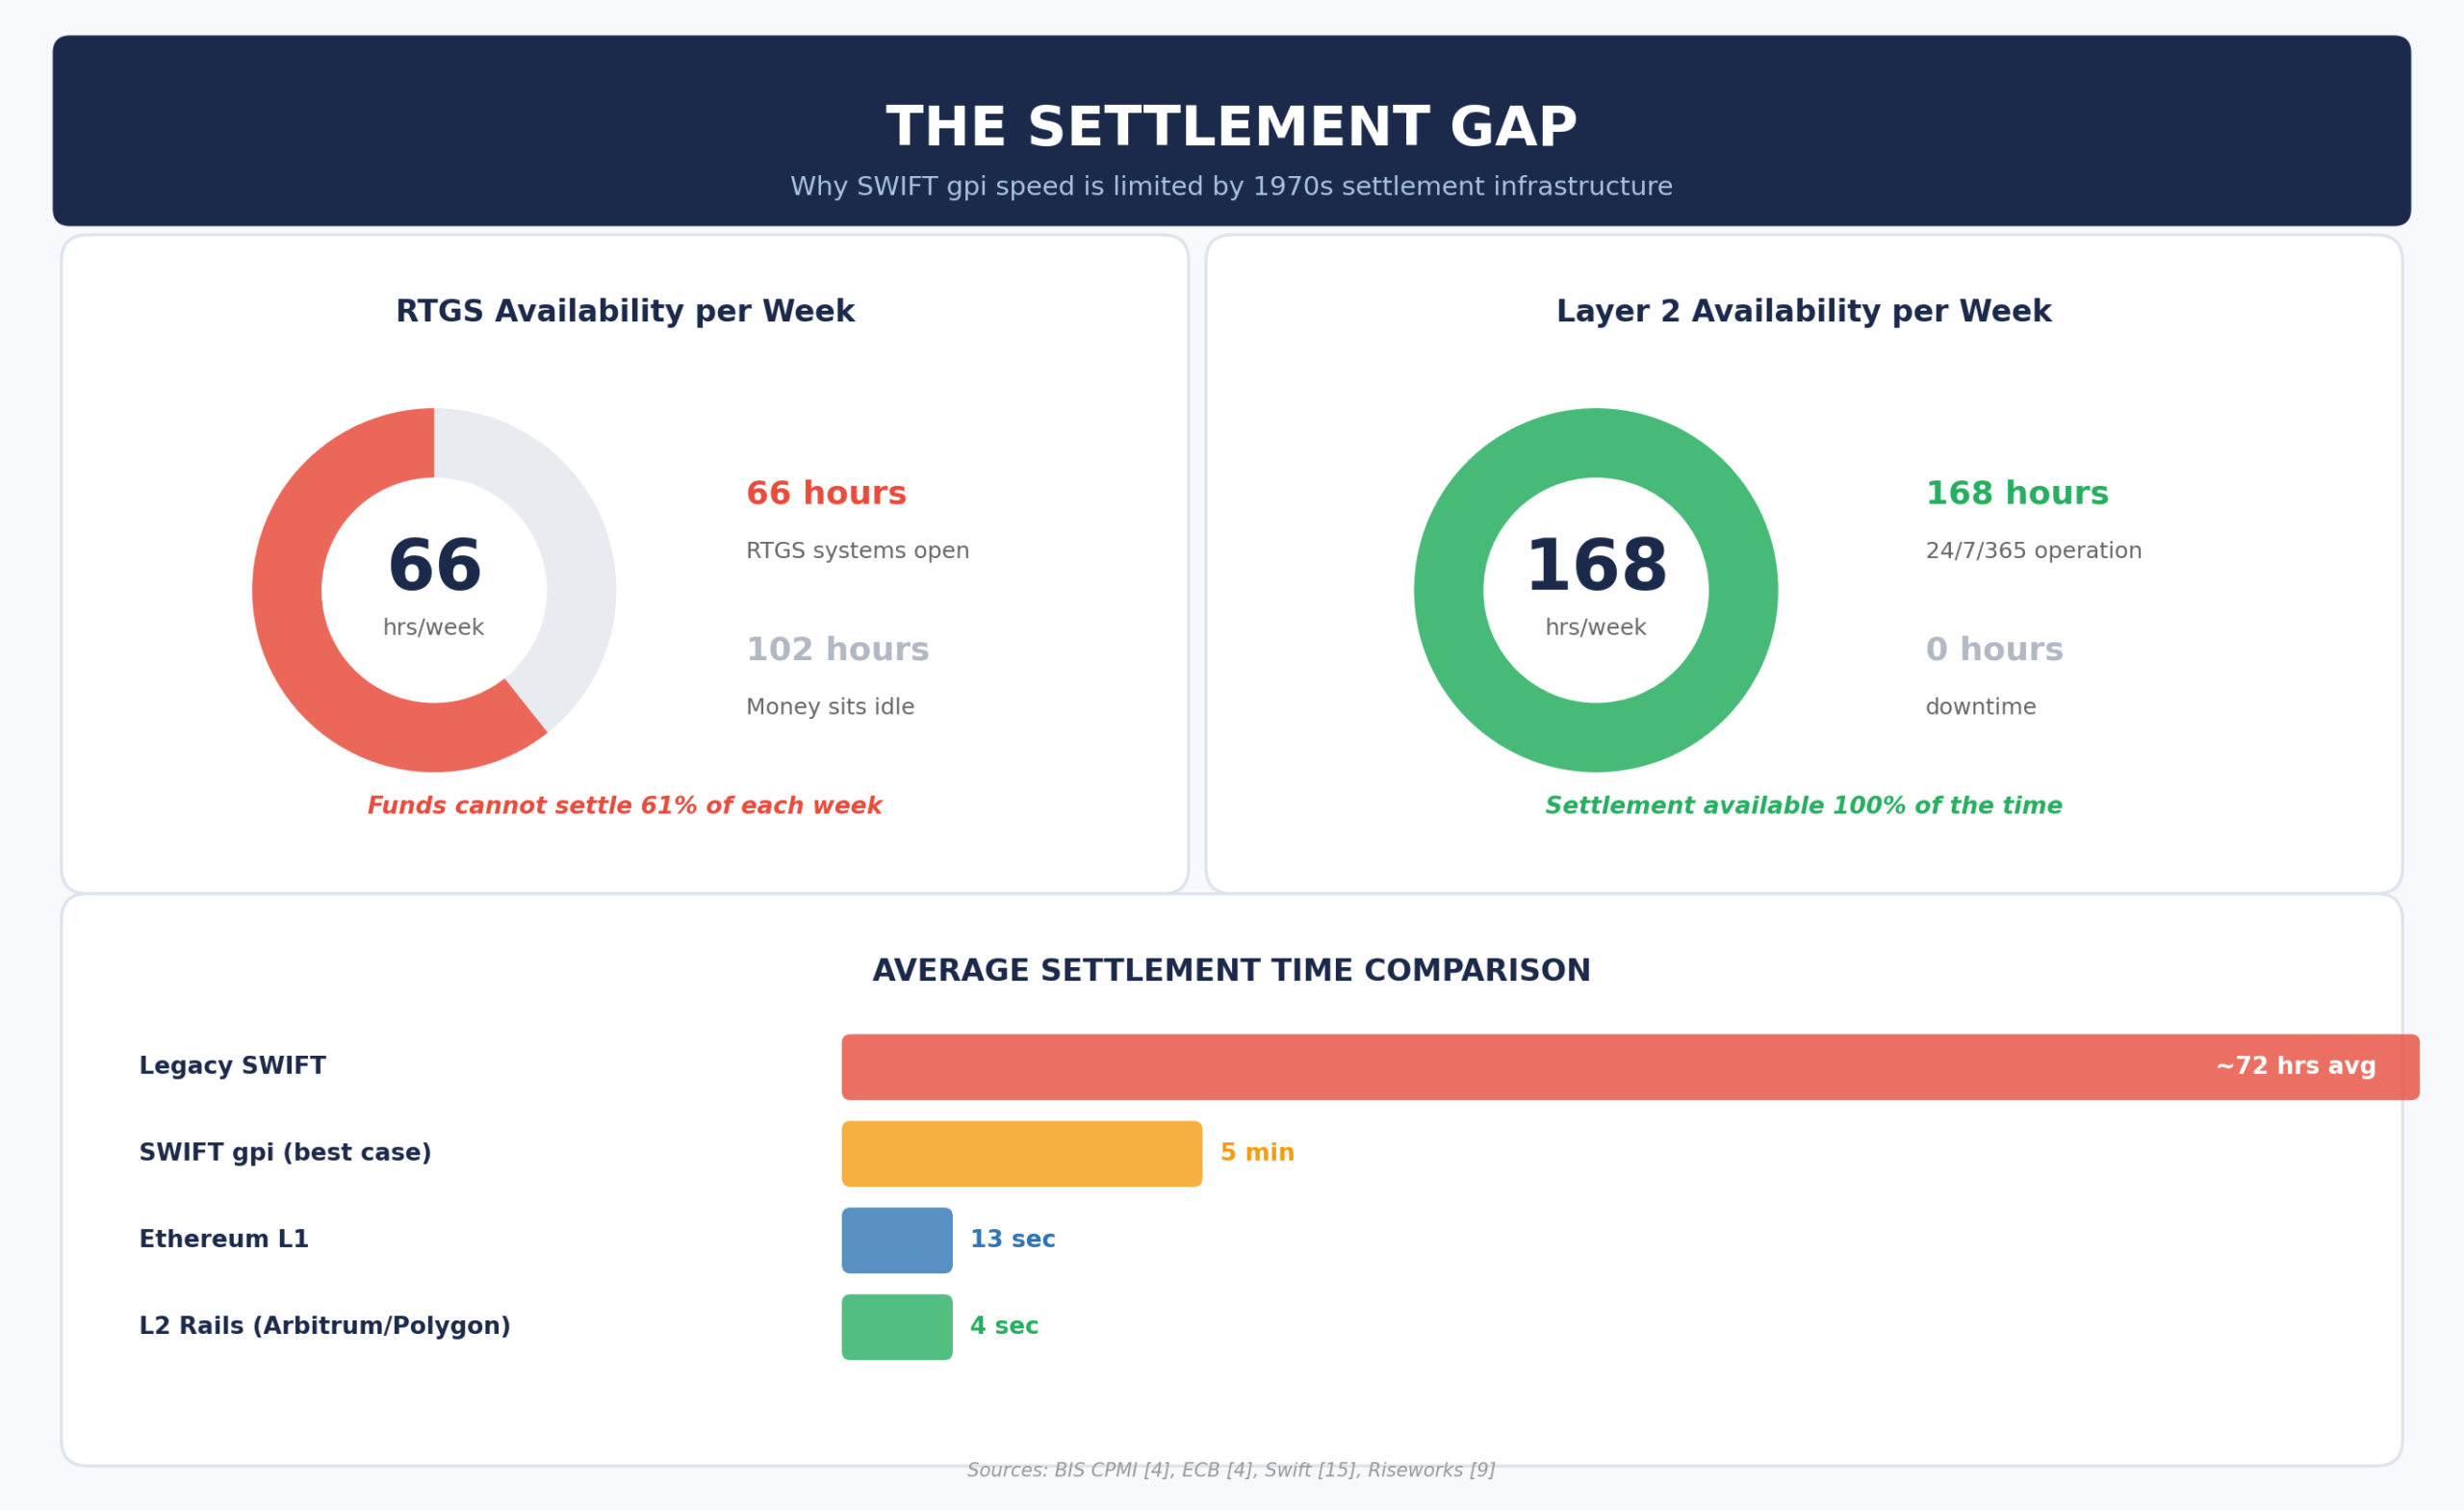
The Layer 2 Alternative: 3–5 Second Settlement, 24/7/365
Hybrid rails built on fiat-backed stablecoins (USDC, regulated euro-tokens) and blockchain infrastructure operate differently. A stablecoin on a Layer 2 network functions as both the message and the settlement—a programmable bearer instrument on a unified ledger. Messaging and asset transfer collapse into a single operation.
By 2026, cross-border B2B stablecoin payments have migrated heavily from the congested Ethereum Layer 1 mainnet to Layer 2 scaling solutions. Arbitrum, Optimism, and Polygon facilitate deterministic settlement in 3–5 seconds, continuously, without regard for banking holidays or RTGS downtime. [9] Specialized providers leveraging Arbitrum integration report an average end-to-end settlement time of 2 minutes for global stablecoin payments. Transaction fees on L2 networks sit below $0.50—often fractions of a cent. [16]
The trade-off is regulatory maturity. These networks bypass the Nostro/Vostro model entirely, which eliminates trapped liquidity costs but also removes the compliance checkpoints that correspondent banking provides.
Latency and Structural Comparison (2026 Averages)
| Infrastructure | Avg. Settlement | Availability | Avg. Cost | Dependency |
|---|---|---|---|---|
| Legacy SWIFT | 1–5 Business Days | 66 hrs/week (RTGS) | High (multi-intermediary) | Nostro/Vostro liquidity |
| SWIFT gpi | 40% < 5 min; 100% < 24 hrs | RTGS-dependent | Medium (correspondent chain) | Bilateral bank trust |
| Ethereum L1 | ~12–15 seconds | 24/7/365 | Variable ($1–$50+) | PoS validators |
| L2 Rails (Arbitrum/Polygon) | 3–5 seconds | 24/7/365 | < $0.50 | Rollup sequencers |
3. The ISO 20022 Paradox: Why the Fix Is Breaking Things
The global financial system mandated a migration from rigid, unstructured MT messaging formats to ISO 20022—an XML-based standard carrying rich remittance data, tax codes, and legal entity identifiers. In theory, ISO 20022 enables automatic invoice matching, enhanced fraud analytics, and significantly improved straight-through processing (STP) rates. Industry projections estimated $332 million in annual operational savings and a 25–30% reduction in false positive compliance alerts. [17] [6]
Adoption has not gone as planned. Because the migration is global but asymmetrical, the industry entered a “coexistence phase.” During this period, many mid-tier institutions and emerging market banks rely on automated translation services to convert rich MX (ISO 20022) messages back into constrained, legacy MT formats. [7]
This translation introduces operational risk. Rich data fields are truncated, lost, or misaligned when compressed into legacy formats. In Indonesia, analysis of rejected customer credit transfers revealed a 5% rejection rate directly caused by invalid regulatory information in unstructured legacy fields. [4] Across the network, banks that have not upgraded their reconciliation engines to parse native XML data cannot use the new standard’s benefits. The result is a persistent manual intervention rate of up to 60% on cross-border flows—caused by data fragmentation, translation errors, and the inability of downstream correspondents to handle structured data without human exception handling. [18] [7]
For businesses, automated reconciliation remains unfulfilled unless both originating and beneficiary institutions run fully modernized, ISO-native core systems. The coexistence phase, designed as a transition bridge, has instead become a bottleneck.
4. The Compliance Tax: The Cost of Screening $1 Quadrillion
Anti-money laundering and know-your-customer regulations have evolved from routine administrative functions into major operational cost centres. In 2026, the financial burden of maintaining cross-border compliance disproportionately impacts mid-size financial institutions and fintechs attempting to scale globally.
Quantifying the Spend
Global financial institutions spend an estimated $206 billion annually on financial crime compliance—covering personnel, software licensing, external audits, and regulatory reporting. North American institutions account for $61 billion. The EMEA region accounts for $85 billion, driven by the multi-jurisdictional complexity of the European Union, the implementation of MiCA, and requirements for Russian and Belarusian sanctions screening. [5] [19]
For mid-size European fintechs, compliance costs consume an average of 19% of annual revenue. The cost is largely driven by redundant investments in siloed systems: transaction monitoring, sanctions screening, identity verification, and case management each operate as disconnected platforms within the same organisation. [20]
The False Positive Problem
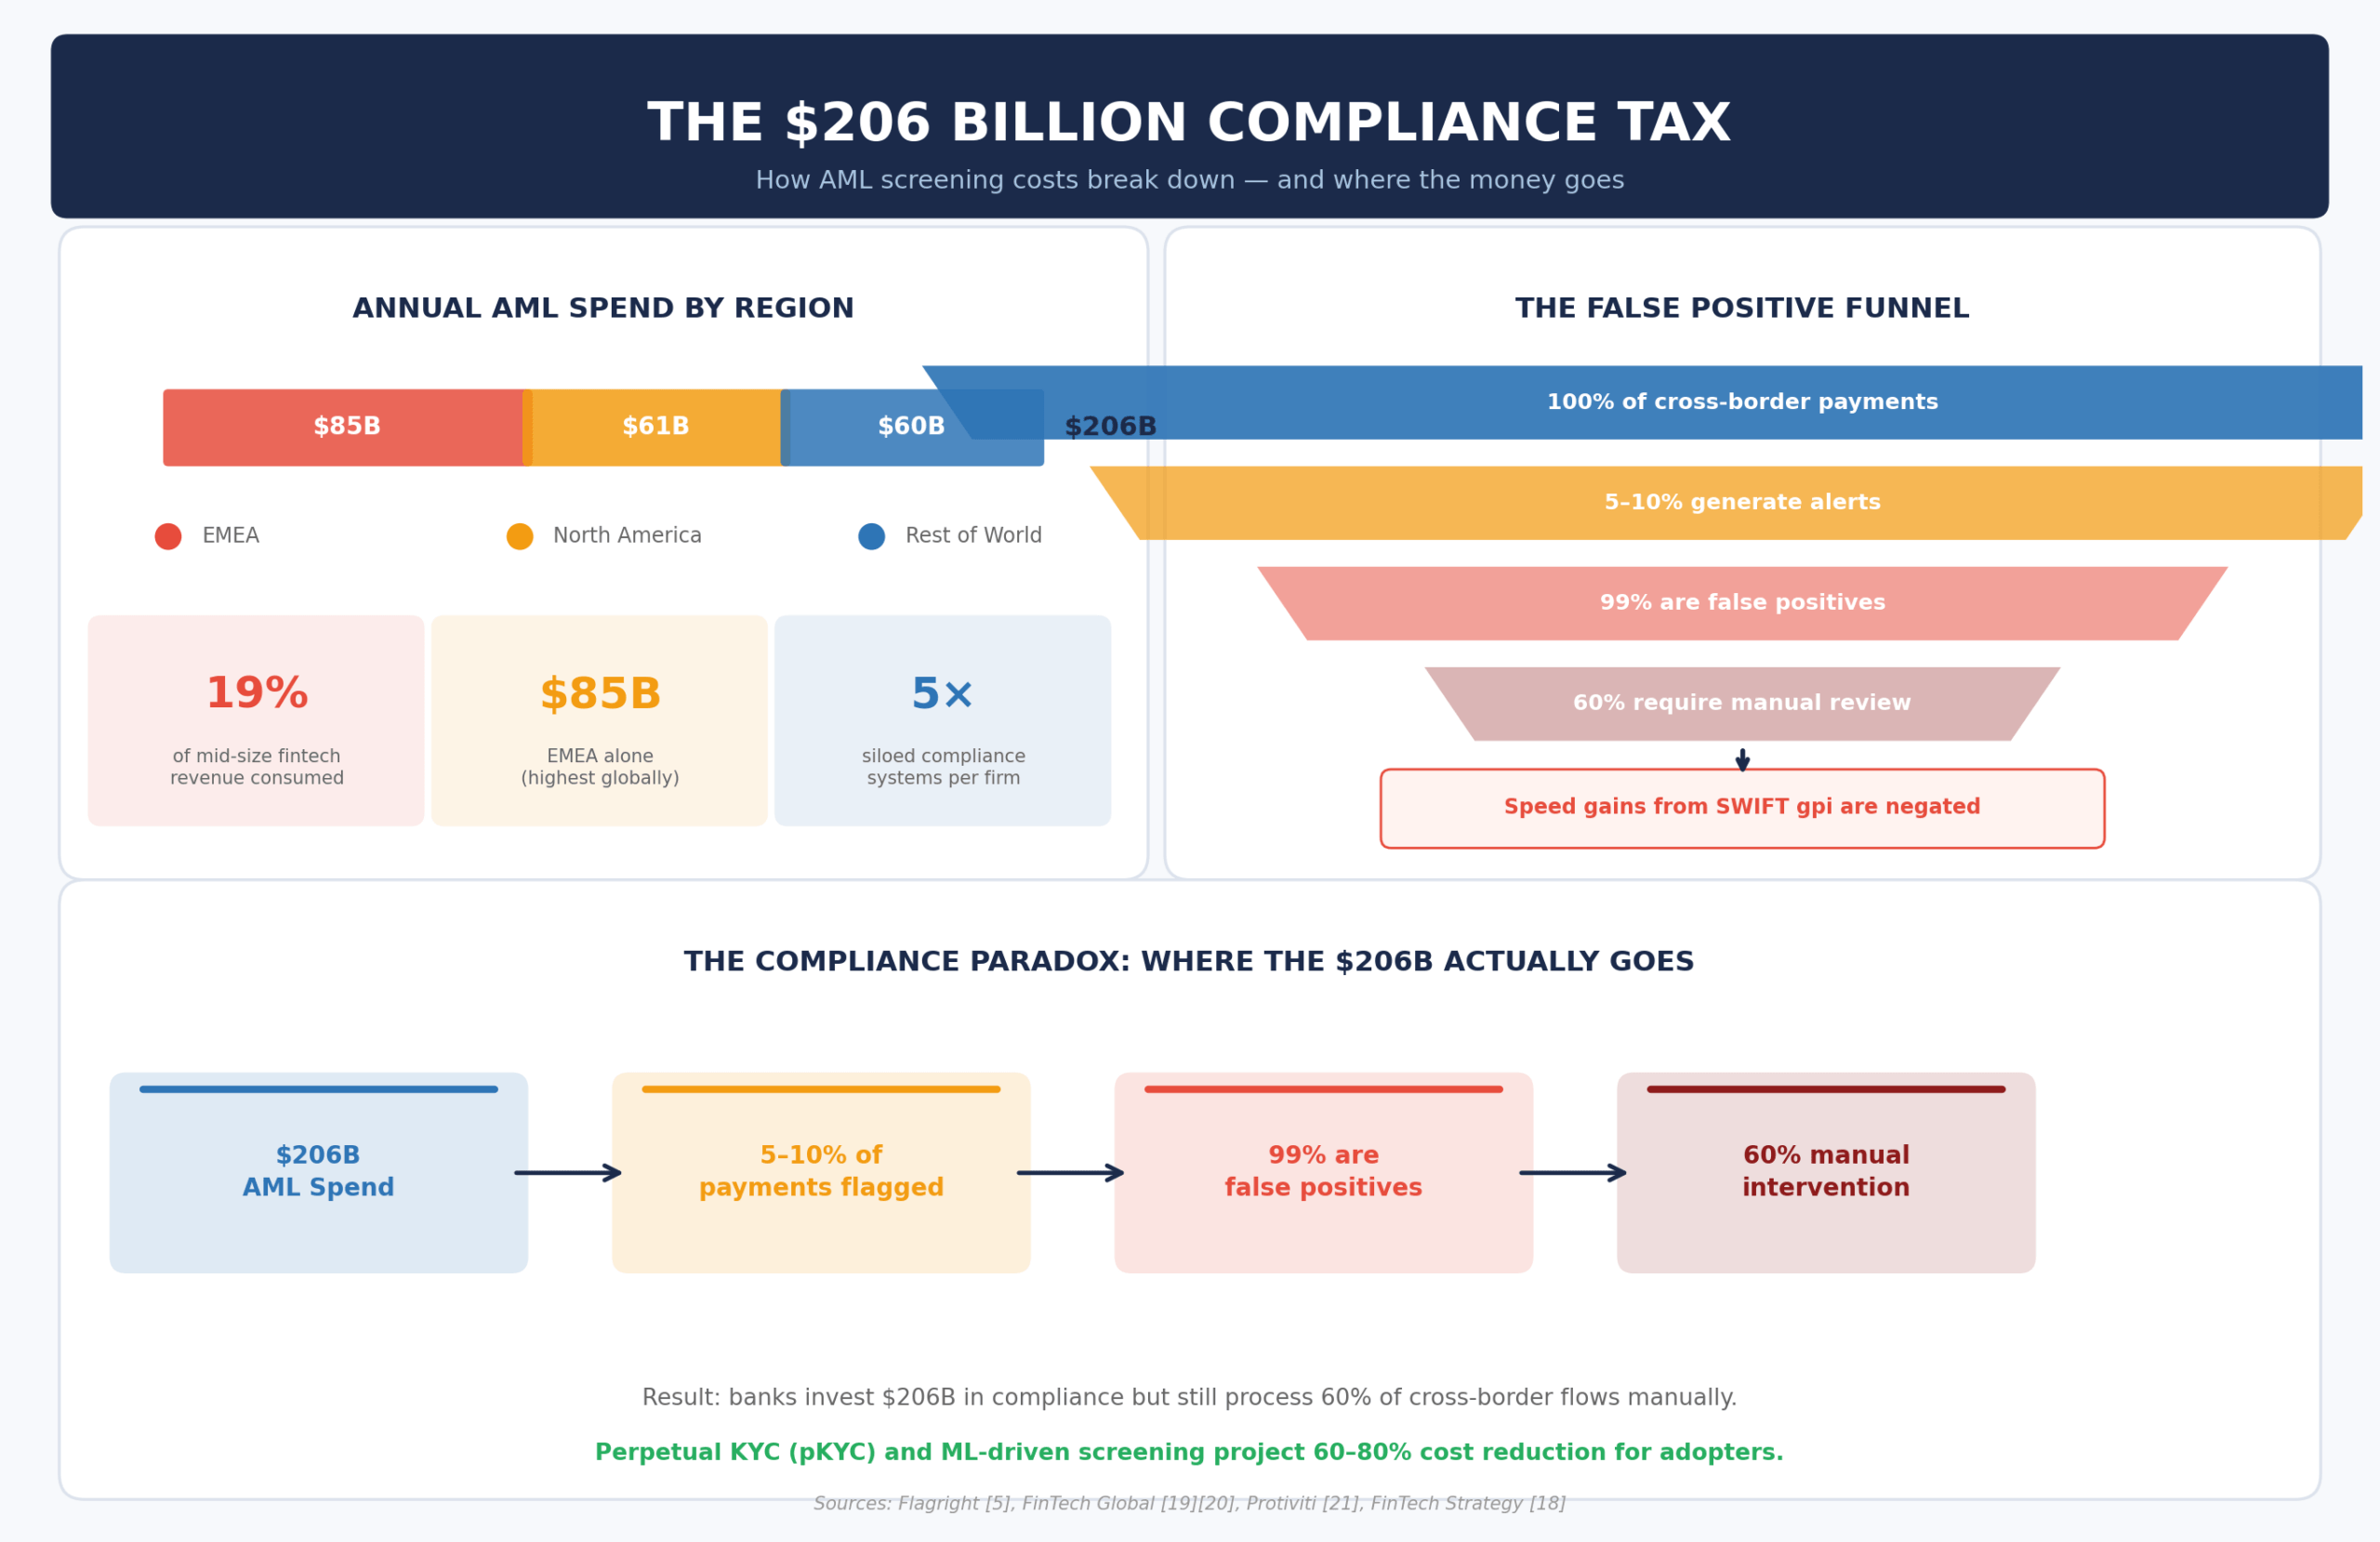
Between 5% and 10% of all cross-border payments generate compliance alerts. Of those, 99% are false positives—triggered by superficial name matches against global watchlists, minor address discrepancies across transliteration standards, or benign variations in corporate entity names. [5] [18]
Each false positive requires manual review. Compliance analysts export data from core transaction ledgers, cross-reference it against sanctions lists and public registries, and work through what the industry calls “swivel-chair” workflows. This manual burden is the primary driver behind high intervention rates on legacy cross-border flows—and it negates the speed improvements delivered by upgraded messaging infrastructure.
The Shift Toward Perpetual KYC
The emerging alternative is Perpetual KYC (pKYC)—continuous monitoring that replaces periodic manual reviews. Institutions deploying machine learning to contextually evaluate risk project 60% to 80% cost savings. The latest AML Index estimates an optimal compliance-spend-to-laundering-prevented ratio of 1.36% to 3.36%. Reaching that range requires significant technological integration—Spain, for example, has demonstrated progress by combining AI-driven automation with the harmonised guidelines of the EU Anti-Money Laundering Authority (AMLA). [21] [19]
AML Compliance Burden (2025–2026 Estimates)
| Metric | Estimated Value | Operational Impact |
|---|---|---|
| Global AML Spend | $206 Billion / Year | Total annual expenditure by banks and fintechs globally |
| EMEA Region Spend | $85 Billion / Year | Highest regional burden; EU fragmentation and geopolitical risk |
| Compliance as % of Revenue | ~19% | Severe drag on profitability for mid-size European fintechs |
| False Positive Alert Rate | 99% | Primary driver of analyst fatigue and operational bloat |
| Manual Intervention Rate | Up to 60% | Legacy cross-border flows requiring human review before settlement |
5. The “Middleman” Spread: Hidden FX Costs in Legacy Corridors
Beyond explicit transfer fees, a significant portion of cross-border payment costs is embedded in the foreign exchange markup. Correspondent banking limits direct market access for end-users, giving intermediary banks pricing power within specific currency corridors.
The World Bank’s monitoring data shows that cross-border payments carry an average cost of 6.49% of the principal transferred. A large portion of this is buried in the exchange rate rather than declared as an upfront fee. [22] Traditional banks use this structure to offset the capital cost of maintaining dormant Nostro accounts—a cost ultimately borne by retail users and SMEs without access to wholesale interbank rates. [102]
Corridor-Specific Pricing: Banks vs. Fintechs
In early 2026, the pricing gap between legacy and fintech providers varies by corridor liquidity. On GBP/EUR—one of the most liquid pairs globally—B2B fintech platforms using API-driven real-time liquidity aggregators achieve an average FX markup of roughly 83 basis points (0.83%). Traditional banks typically apply 0.85%–1.00%, capturing the difference as margin. [23] [24]
The gap widens in secondary corridors. For EUR/PLN (Euro to Polish Zloty) and EUR/BRL (Euro to Brazilian Real), fintech money transmitters average 96 basis points (0.96%). Traditional banks, lacking direct clearing capabilities in Latin American or Eastern European domestic systems, route through secondary or tertiary correspondents. This pushes the hidden FX markup beyond 1.25%. [23]
A newer category of licensed hybrid neobanks—providers that combine virtual IBANs with stablecoin-based settlement—compresses these margins further by collecting funds via domestic rails (SEPA, Faster Payments) and settling from pre-funded pools in the destination country, bypassing the correspondent chain entirely.
FX Margin by Corridor (Early 2026)
| Corridor Tier | Currency Pairs | Bank FX Markup | Fintech FX Markup | Spread Driver |
|---|---|---|---|---|
| Tier 1 (High Liquidity) | GBP/EUR, USD/JPY | 0.85%–1.00% | ~0.83% (83 bps) | Competitive interbank markets |
| Tier 2 (Emerging) | EUR/PLN, EUR/BRL | 1.00%–1.25%+ | ~0.96% (96 bps) | Fragmented liquidity, secondary correspondents |
6. The Risks: Illicit Finance and the Stablecoin Problem
The same permissionless architecture that reduces cross-border friction also reduces friction for illicit finance. This section presents the data.
The Scale of On-Chain Financial Crime
According to Chainalysis and TRM Labs, the volume of cryptocurrency associated with illicit activity reached $158 billion in 2025—a 145% increase year-over-year from 2024. In relative terms, this is 1.2% of total on-chain volume. [8] [25] Sanctioned entities experienced a 694% increase in illicit value received. [26] Chinese-language escrow and money laundering networks processed over $100 billion in 2025, operating as decentralised Liquidity-as-a-Service infrastructure for cross-border black markets. [25]
Stablecoins as the Dominant Vector
By 2026, stablecoins account for 84% of all illicit transaction volume. [8] A digital asset pegged to a fiat currency that can move millions in seconds without passing through a correspondent bank’s compliance filters is precisely what makes stablecoins attractive to sanctioned actors. The ruble-backed A7A5 stablecoin processed between $72 billion and $93 billion in transaction volume in under a year. Associated wallet clusters show coordinated activity tied directly to Russian sanctions evasion. [26] Iran and Venezuela have similarly relied on decentralised rails for sanctions-constrained payments. North Korean state-sponsored actors stole over $2 billion in cryptocurrency in 2025. [8]
These realities are driving regulatory responses. The GENIUS Act in the United States and MiCA in Europe represent the first comprehensive stablecoin frameworks—mandating 100% reserve backing and institutional-grade AML programs. Hybrid rails solve operational problems, but they also create new compliance challenges that the industry is still learning to address.
7. The 2027 Horizon: Programmable Money and Unified Ledgers
The Bank for International Settlements (BIS) has outlined the concept of a “unified ledger” in its Annual Economic Report 2025—a digital infrastructure hosting tokenised central bank reserves, commercial bank money, and government securities on a shared, interoperable platform. Tokenisation collapses messaging, asset transfer, and ledger reconciliation into a single operation, enabling delivery-versus-payment (DvP) settlement that eliminates principal risk and temporal delays. [27] [28]
The IMF’s complementary framework (Working Paper WP/24/177) outlines two vectors for the 2027 horizon. External programmatic access allows regulated fintechs and corporate ERP systems to interface with core payment systems via code—enabling composability and embedded finance without compromising perimeter security. Internal programmatic capabilities give the central ledger itself the ability to execute smart contracts, allowing automated compliance enforcement and dynamic liquidity routing. [29]
On the legislative side, the GENIUS Act (enacted July 2025) provides the United States’ first comprehensive stablecoin framework. It requires Permitted Payment Stablecoin Issuers to maintain 100% reserve backing in liquid assets and subjects them to federal or state prudential supervision. The Act also mandates institutional-grade AML programs—imposing traditional bank-level compliance requirements on crypto-native issuers.
In Europe, MiCA came into full enforcement in 2024–2025, establishing reserve requirements, prudential oversight, and AML obligations for stablecoin issuers across EU member states. [30] The two frameworks, taken together, signal a global regulatory convergence: hybrid rails will operate under the same compliance expectations as traditional banking, while offering the programmability and settlement speed of blockchain infrastructure.
The trajectory is a synthesis. Not the preservation of the analog Nostro/Vostro model, and not the unregulated expansion of permissionless chains. It is the integration of tokenised assets into sovereign monetary systems—cryptographic programmability operating within institutional and regulatory guardrails.
Methodology
This report synthesises publicly available data, institutional research, and regulatory filings from Q3 2024 through Q1 2026. All figures represent estimates based on the best available public data. Variance between sources is noted where material. This report does not constitute financial advice.
References
- [1] BIS CPMI, “Moving on up: results of the 2024 cross-border payments survey.” https://www.bis.org/cpmi/publ/brief10.pdf
- [2] BIS CPMI, “New correspondent banking data — the decline continues.” https://www.bis.org/cpmi/paysysinfo/corr_bank_data/corr_bank_data_commentary_1905.htm
- [3] Yellow Card, “The Correspondent Banking Crisis: Why 127 Banks Exited,” 2025. https://yellowcard.io/blog/the-correspondent-banking-crisis/
- [4] European Central Bank, “The quest for cheaper and faster cross-border payments.” https://www.ecb.europa.eu/press/key/date/2025/html/ecb.sp250627~de084f5b69.en.html
- [5] Flagright, “Overcoming the Hidden Costs of AML Compliance,” 2025. https://www.flagright.com/post/overcoming-the-hidden-costs-of-aml-compliance
- [6] Deloitte US, “ISO 20022 Migration Readiness,” 2025. https://www.deloitte.com/us/en/services/consulting/articles/preparing-for-iso-20022-migration.html
- [7] ThoughtWorks, “Becoming ISO-native,” 2025. https://www.thoughtworks.com/en-us/insights/articles/becoming-ISO-native-navigating-end-of-coexistence-in-ISO-20022-migration-journey
- [8] Chainalysis, “2026 Crypto Crime Report.” https://www.chainalysis.com/blog/2026-crypto-crime-report-introduction/
- [9] Riseworks, “2025 Crypto Payroll Report.” https://www.riseworks.io/blog/2025-crypto-payroll-report
- [10] World Bank, “Safeguarding Financial Lifelines in the Pacific.” https://www.worldbank.org/en/news/feature/2025/09/02/safeguarding-financial-lifelines-in-the-pacific
- [11] World Bank, “Pacific Strengthening Correspondent Banking Relationships Project.” https://documents.worldbank.org/en/publication/documents-reports/documentdetail/099020826175517050
- [12] World Bank, “De-Risking in the Financial Sector.” https://www.worldbank.org/en/topic/financialsector/brief/de-risking-in-the-financial-sector
- [13] De Haas, R. et al., “De-Risking by Banks in Emerging Markets.” https://ralphdehaas.com/wp-content/uploads/2025/09/DP19373_2.pdf
- [14] ACI Worldwide, “Swift’s Global Payments Innovation (gpi).” https://www.aciworldwide.com/what-is-swift-gpi
- [15] Swift, “A year of shared progress: 5 highlights from 2025.” https://www.swift.com/news-events/news/year-shared-progress-5-highlights-2025
- [16] Wazarat Ali Hussain, “Stablecoins 2025: A Layered Market Map.” https://wazarat.medium.com/stablecoins-2025-a-layered-market-map-and-practical-guide-7aecc167b18e
- [17] LexisNexis, “Payments Trends 2026.” https://risk.lexisnexis.com/insights-resources/infographic/payments-trends
- [18] FinTech Strategy, “Advanced Payments & Fintech Report 2026.” https://www.fintechstrategy.com/blog/author/dbrightmore/
- [19] FinTech Global, “Managing AML total cost of ownership in 2026.” https://fintech.global/2026/02/19/managing-aml-total-cost-of-ownership-in-2026/
- [20] FinTech Global, “The high price of non-compliance.” https://fintech.global/2025/03/31/the-high-price-of-non-compliance-in-financial-services/
- [21] Protiviti Global, “Compliance Priorities for 2026.” https://www.protiviti.com/gl-en/whitepaper/compliance-priorities-2026
- [22] World Bank, “Remittance Prices Worldwide.” https://remittanceprices.worldbank.org/
- [23] Du, W. et al., “Competing Rails for Cross-Border Payments.” https://www.hbs.edu/ris/Publication%20Files/Du_Huang_Scharfstein_14Feb2016_66992079-2e6b-4584-95cf-014441c77485.pdf
- [24] Stripe, “The State of B2B Cross-Border Payments Explained.” https://stripe.com/resources/more/the-state-of-b2b-cross-border-payments
- [25] TRM Labs, “2026 Crypto Crime Report.” https://www.trmlabs.com/reports-and-whitepapers/2026-crypto-crime-report
- [26] Chainalysis, “Crypto Sanctions: 2026 Crypto Crime Report.” https://www.chainalysis.com/blog/crypto-sanctions-2026/
- [27] BIS, “The next-generation monetary and financial system.” https://www.bis.org/publ/arpdf/ar2025e3.htm
- [28] BIS, Annual Economic Report 2025. https://www.bis.org/publ/arpdf/ar2025e.pdf
- [29] IMF, “Programmability in Payment and Settlement,” 2024. https://www.imf.org/-/media/files/publications/wp/2024/english/wpiea2024177-print-pdf.pdf
- [30] Unnax, “EU Fintech Regulations 2026.” https://www.unnax.com/eu-fintech-regulations-2026/
© 2026. Research compiled from public institutional sources. Not financial advice.
FAQ
Two interlocking bottlenecks. First, national RTGS systems operate for an average of 66 hours per week—regardless of how fast the SWIFT gpi message arrives, actual settlement waits for the domestic clearing window. Second, the ISO 20022 migration’s coexistence phase forces data through lossy format translations, creating manual intervention on a significant share of flagged transactions. See Sections 2 and 3 for detailed analysis.
Virtual IBANs allow businesses to collect and hold funds in multiple currencies and jurisdictions without maintaining physical bank accounts or the trapped Nostro liquidity those accounts require. They connect directly to domestic payment rails (SEPA, Faster Payments, SWIFT), enabling same-day fund collection. When paired with blockchain-based settlement, virtual IBANs compress the multi-day correspondent banking cycle into near-instant transfers. The key benefit is structural: they decouple the ability to send and receive international payments from the need to maintain bilateral correspondent banking relationships.
MiCA establishes reserve backing requirements, prudential supervision, and AML obligations for stablecoin issuers operating in EU markets. For cross-border settlement, MiCA provides the legal framework that enables regulated financial institutions to accept compliant stablecoins as settlement instruments. It does not endorse specific technologies—it creates the regulatory conditions under which hybrid settlement can operate within existing financial law. Combined with the GENIUS Act in the United States, it marks the beginning of a global regulatory alignment for stablecoin-based payments.
The coexistence phase is the transitional period during which banks running legacy MT messaging formats must interoperate with institutions that have adopted the new ISO 20022 (MX) standard. Because adoption is uneven globally, many mid-tier banks rely on automated translation services to convert between formats. This translation frequently truncates or corrupts rich data fields, which triggers compliance flags and manual review. The phase was intended as a temporary bridge; in practice, it has become a persistent source of friction that will not resolve until the majority of institutions complete full ISO-native upgrades.


Try the free app
Bring digital & fiat together, with no compromise!


